Here follows a table with all the temperature extremes recorded
at Cima Grappa since June 2009.
| MINIMUM TEMPERATURE | DAY | MAXIMUM TEMPERATURE | DAY | |
| JANUARY | -11.8°C | 31/01/2012 | 13.5°C | 10/01/2015 |
| FEBRUARY | -14.8°C | 05/02/2012 | 15.1°C | 25-29/02/2012 |
| MARCH | -13.5°C | 09/03/2010 | 18.6°C | 02/03/2012 |
| APRIL | -7.4°C | 09/04/2012 | 18.9°C | 07/04/2011 |
| MAY | -2.8°C | 16/05/2012 | 22.6°C | 12/05/2012 |
| JUNE | 3.1°C | 20/06/2010 | 22.3°C | 30/06/2012 |
| JULY | 4.3°C | 18/07/2009 | 24.7°C | 06/07/2015 |
| AUGUST | 4.2°C | 31/08/2010 | 26.9°C | 22/08/2011 |
| SEPTEMBER | -0.9°C | 30/09/2015 | 19.8°C | 11/09/2011 |
| OCTOBER | -6.9°C | 30/10/2012 | 19.4°C | 21/10/2012 |
| NOVEMBER | -9.8°C | 27/11/2010 | 19.6°C | 10/11/2015 |
| DECEMBER | -14.6°C | 20/12/2009 | 14.1°C | 23/12/2014 |
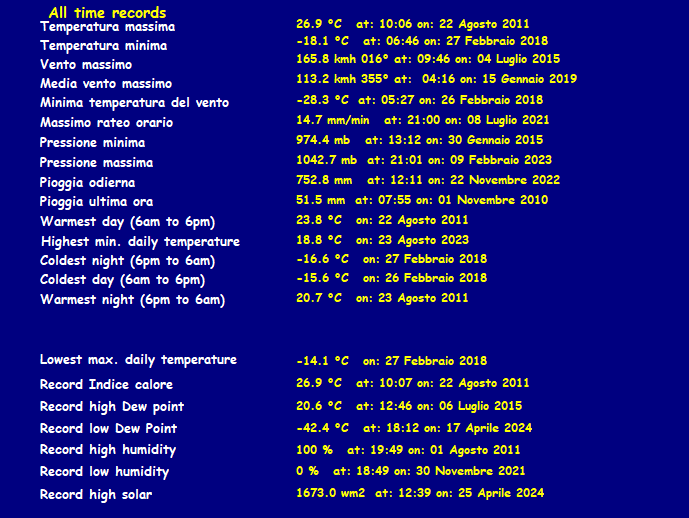
| RECORD | -14.8°C | 05/02/2012 | 26.9°C | 22/08/2011 |
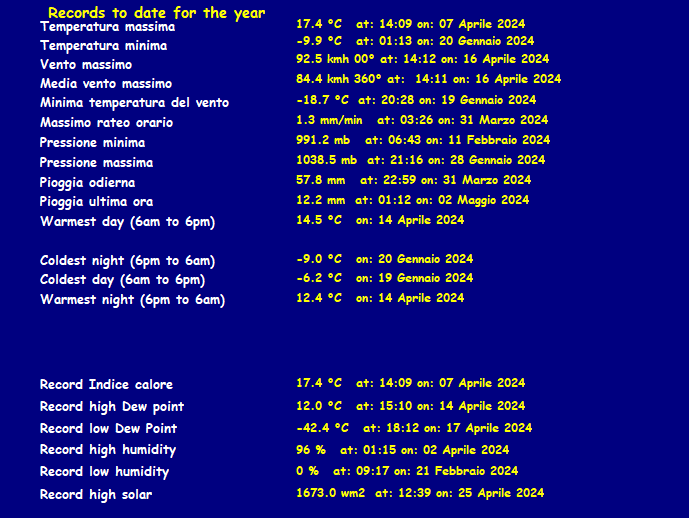
CURRENT MONTH RECORD

CURRENT YEAR RECORD

ALL TIME RECORD

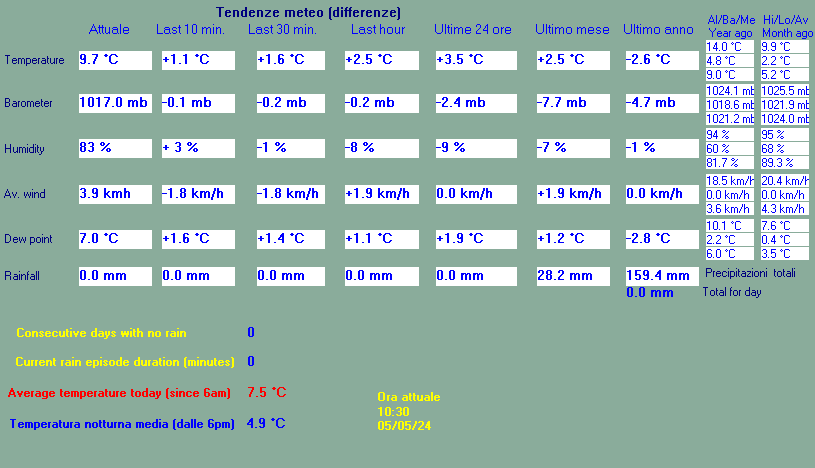
TREND


